Your Trusted Partner in Real Estate. Contact me at 1-403-775-0272 for all your property needs.


Quick answer: Seton is a balanced market leaning toward buyers for detached homes right now. The September 2026 benchmark price is $728,400, down 3.47% from a year ago. Five homes sold, there are 4.6 months of supply, and homes took an average of 47 days to sell at 97.4% of list price. Buyers have choice and room to negotiate, but homes are selling twice as fast as they did last fall.
If you own a home in Seton, or you're thinking about buying in this fast-growing SE Calgary community near the South Health Campus, here's the straight breakdown of what happened in September and what it means for you. All numbers below are for detached homes only.
Stat (detached) | Sep 2026 | vs. Aug 2026 | vs. Sep 2025 |
|---|---|---|---|
Benchmark price | $728,400 | down 4.33% | down 3.47% |
Average sale price | $662,980 | down 8.16% | down 6.32% |
Median sale price | $645,000 | down 7.86% | down 8.57% |
Sales | 5 | no change | down 37.5% |
New listings | 11 | down 8.33% | down 35.29% |
Inventory (active listings) | 23 | down 32.35% | down 23.33% |
Sales-to-new-listings ratio | 45.45% | 41.67% in Aug | 47.06% in Sep 2025 |
Months of supply | 4.6 | down 32.35% | up 22.67% |
Average days on market | 47 | down 27.69% | down 51.04% |
Sale-to-list price | 97.4% | 97.6% in Aug | 97.5% in Sep 2025 |
Dollar volume | $3,314,900 | down 8.16% | down 41.45% |
Source: [add your stats source, e.g. CREB®], Seton detached homes, September 2026.
Values have softened, but modestly. The benchmark price is the best measure of what a typical Seton detached home is worth, because it isn't skewed by which homes happened to sell that month. At $728,400, it's down 4.33% from August and 3.47% from last year. That's a real dip, not a crash.
Why the average and median look lower. The average sale price fell to $662,980 and the median to $645,000. With only 5 sales, one or two smaller homes can pull those numbers down fast. That's why the median dropped 8.57% year over year while the benchmark only slipped 3.47%.
The takeaway: Both the average and median sit $65,000 to $85,000 below the benchmark. That means September's sales leaned toward smaller or entry-level homes, not that every Seton home lost that much value. Always look at the benchmark first.
It's balanced, tilting toward buyers. Two numbers tell the story:
Months of supply: 4.6. If no new listings came on, it would take about four and a half months to sell everything available. Under 2 months usually favours sellers, 2 to 4 months is balanced, and over 4 starts to favour buyers.
Sales-to-new-listings ratio: 45.45%. Roughly 5 homes sold for every 11 that hit the market. Between 40% and 60% is generally considered balanced.
What changed from August: Sales held at 5, but inventory dropped 32.35% to 23 homes and months of supply fell from 6.8 to 4.6. Fewer sellers listing (11 new listings, down from 12) is tightening supply heading into fall.
What changed from last year: Sales are down from 8 to 5, but new listings are down even more (35.29%) and inventory is down 23.33%. Months of supply is higher than last September (4.6 vs. about 3.75), so buyers still have a bit more leverage than a year ago.
Homes are selling much faster. Average days on market is 47, down 51.04% from 96 days last September and down 27.69% from August. Well-priced Seton homes are moving.
Price it right from day one. Homes sold for 97.4% of list price on average. On a $700,000 listing, that's about $18,000 of negotiating room. Overpriced homes are the ones sitting well past 47 days.
You're competing with newer homes. Seton still has builders selling new product. Clean, staged, well-photographed resale homes need to stand out against show homes.
Less competition from other resale listings. Inventory is down 23.33% from last year and 32.35% from August. If your home is priced and prepped properly, you're not fighting a flood of supply.
Plan for a 6 to 8 week timeline. That's faster than last fall, but not the quick weekend sales of a hot spring market.
You have options and time. At 4.6 months of supply, you're rarely racing multiple offers.
There's room to negotiate. Sellers are accepting about 2.6% under list on average. Conditions like financing and inspection are on the table.
Prices are lower than last year. The benchmark is down 3.47% year over year, so you're buying in below last fall's level.
Don't wait too long. Inventory is shrinking and homes are selling twice as fast as last year. Fall still gives you better terms than spring will.
In September 2026, the benchmark price for a detached home in Seton was $728,400. The average sale price was $662,980 and the median was $645,000.
Modestly. The benchmark price is down 3.47% from September 2025 and 4.33% from August 2026. That's a small correction, not a steep decline.
Detached homes sold in an average of 47 days in September 2026, down from about 96 days a year earlier.
It's a balanced market leaning toward buyers, with 4.6 months of supply and a 45.45% sales-to-new-listings ratio.
Homes sold for 97.4% of list price on average in September 2026, or about 2.6% below asking.
There were 23 detached homes on the market at the end of September 2026, with 11 new listings added during the month.
Community stats tell you the trend. They don't tell you what your home is worth or which listing is the right buy. That takes someone who knows Seton street by street, and how resale stacks up against what the builders are offering.
The Hanney Nelson Real Estate Team with Royal LePage Benchmark has helped Calgary families buy and sell for over 25 years, and we're ranked in the top 1% of Royal LePage agents across Canada. Call or text Josh at 403-862-2877 for a free home evaluation or a no-pressure chat about your next move.

Quick answer: Douglasdale/Glen is a balanced market for detached homes right now. The September 2026 benchmark price is $723,200, down 1.81% from a year ago. Eight homes sold, there are 3.13 months of supply, and homes took an average of 31 days to sell at 96.88% of list price. Buyers have more room to negotiate than they did this summer, but well-priced homes are still selling.
If you own a home in Douglasdale or Douglas Glen, or you're thinking about buying in this established SE Calgary community along the Bow River, here's the straight breakdown of what happened in September and what it means for you. All numbers below are for detached homes only.
Stat (detached) | Sep 2026 | vs. Aug 2026 | vs. Sep 2025 |
|---|---|---|---|
Benchmark price | $723,200 | down 0.99% | down 1.81% |
Average sale price | $639,125 | down 15.54% | down 5.75% |
Median sale price | $648,000 | down 6.09% | up 0.27% |
Sales | 8 | down 52.94% | no change |
New listings | 18 | down 14.29% | down 21.74% |
Inventory (active listings) | 25 | up 31.58% | no change |
Sales-to-new-listings ratio | 44.44% | 80.95% in Aug | 34.78% in Sep 2025 |
Months of supply | 3.13 | up 179.46% | no change |
Average days on market | 31 | up 14.81% | up 72.22% |
Sale-to-list price | 96.88% | 98.29% in Aug | 98% in Sep 2025 |
Dollar volume | $5,113,000 | down 60.25% | down 5.75% |
Source: [add your stats source, e.g. CREB®], Douglasdale/Glen detached homes, September 2026.
Values are holding steady. The benchmark price is the best measure of what a typical Douglasdale/Glen detached home is worth, because it isn't skewed by which homes happened to sell that month. At $723,200, it's down less than 1% from August and under 2% from last year. That's a small dip, not a drop.
Why the average price looks scarier than it is. The average sale price fell 15.54% from August to $639,125. With only 8 sales, a few lower-priced homes changing hands can pull that number down fast. The median price ($648,000) is actually up 0.27% from last September, which tells you prices are flat year over year, not falling off a cliff.
The takeaway: Both the average and median are well below the benchmark. That means September's sales leaned toward smaller or older homes, not that every home in the community lost $80,000 in value. Always look at the benchmark first.
It's a balanced market. Two numbers tell the story:
Months of supply: 3.13. If no new listings came on, it would take just over three months to sell everything available. Under 2 months usually favours sellers, 2 to 4 months is balanced, and over 4 starts to favour buyers.
Sales-to-new-listings ratio: 44.44%. Roughly 4 homes sold for every 9 that hit the market. Between 40% and 60% is generally considered balanced.
What changed from August: August was hot, with 17 sales and an 80.95% sales-to-new-listings ratio. September cooled off sharply: sales fell to 8, inventory climbed 31.58% to 25 homes, and months of supply nearly tripled from about 1.1 to 3.13. Part of that is the normal fall slowdown after the summer rush.
What changed from last year: Sales (8) and inventory (25) are identical to September 2025. But new listings are down 21.74%, so fewer sellers are coming to market, and demand relative to supply is actually stronger than last fall (44.44% vs. 34.78%).
Homes are taking longer to sell. Average days on market is 31, up 72.22% from last September and up 14.81% from August. Buyers are taking their time, comparing options and negotiating.
Price it right from day one. Homes sold for 96.88% of list price on average, down from 98.29% in August. On a $700,000 listing, that's about $22,000 of negotiating room. Overpriced homes are the ones sitting past 31 days.
Presentation matters again. With 25 homes to choose from, buyers are comparing. Clean, staged, well-photographed homes win.
Less competition from new listings. New listings are down 21.74% from last year. If your home is priced and prepped properly, you're not fighting a flood of supply.
Plan for a slightly longer timeline. Budget for 4 to 6 weeks to sell, not the quick weekend sales we saw in spring and summer.
You have options and time. Inventory is up 31.58% from August, and you're no longer racing multiple offers on every home.
There's room to negotiate. Sellers are accepting about 3% under list on average. Conditions like financing and inspection are back on the table.
Values are stable. The benchmark is down less than 2% year over year, so you're buying into a steady market, not a falling one.
Fall is a smart time to buy. Less competition now usually means better terms than you'll get when spring buyers return.
In September 2026, the benchmark price for a detached home in Douglasdale/Glen was $723,200. The average sale price was $639,125 and the median was $648,000.
Only slightly. The benchmark price is down 1.81% from September 2025 and 0.99% from August 2026. The median price is up 0.27% year over year, so values are essentially flat.
Detached homes sold in an average of 31 days in September 2026, up from about 18 days a year earlier.
It's a balanced market, with 3.13 months of supply and a 44.44% sales-to-new-listings ratio.
Homes sold for 96.88% of list price on average in September 2026, or about 3% below asking.
There were 25 detached homes on the market at the end of September 2026, with 18 new listings added during the month.
Community stats tell you the trend. They don't tell you what your home is worth or which listing is the right buy. That takes someone who knows Douglasdale and Douglas Glen street by street.
The Hanney Nelson Real Estate Team with Royal LePage Benchmark has helped Calgary families buy and sell for over 25 years, and we're ranked in the top 1% of Royal LePage agents across Canada. Call or text Josh at 403-862-2877 for a free home evaluation or a no-pressure chat about your next move.

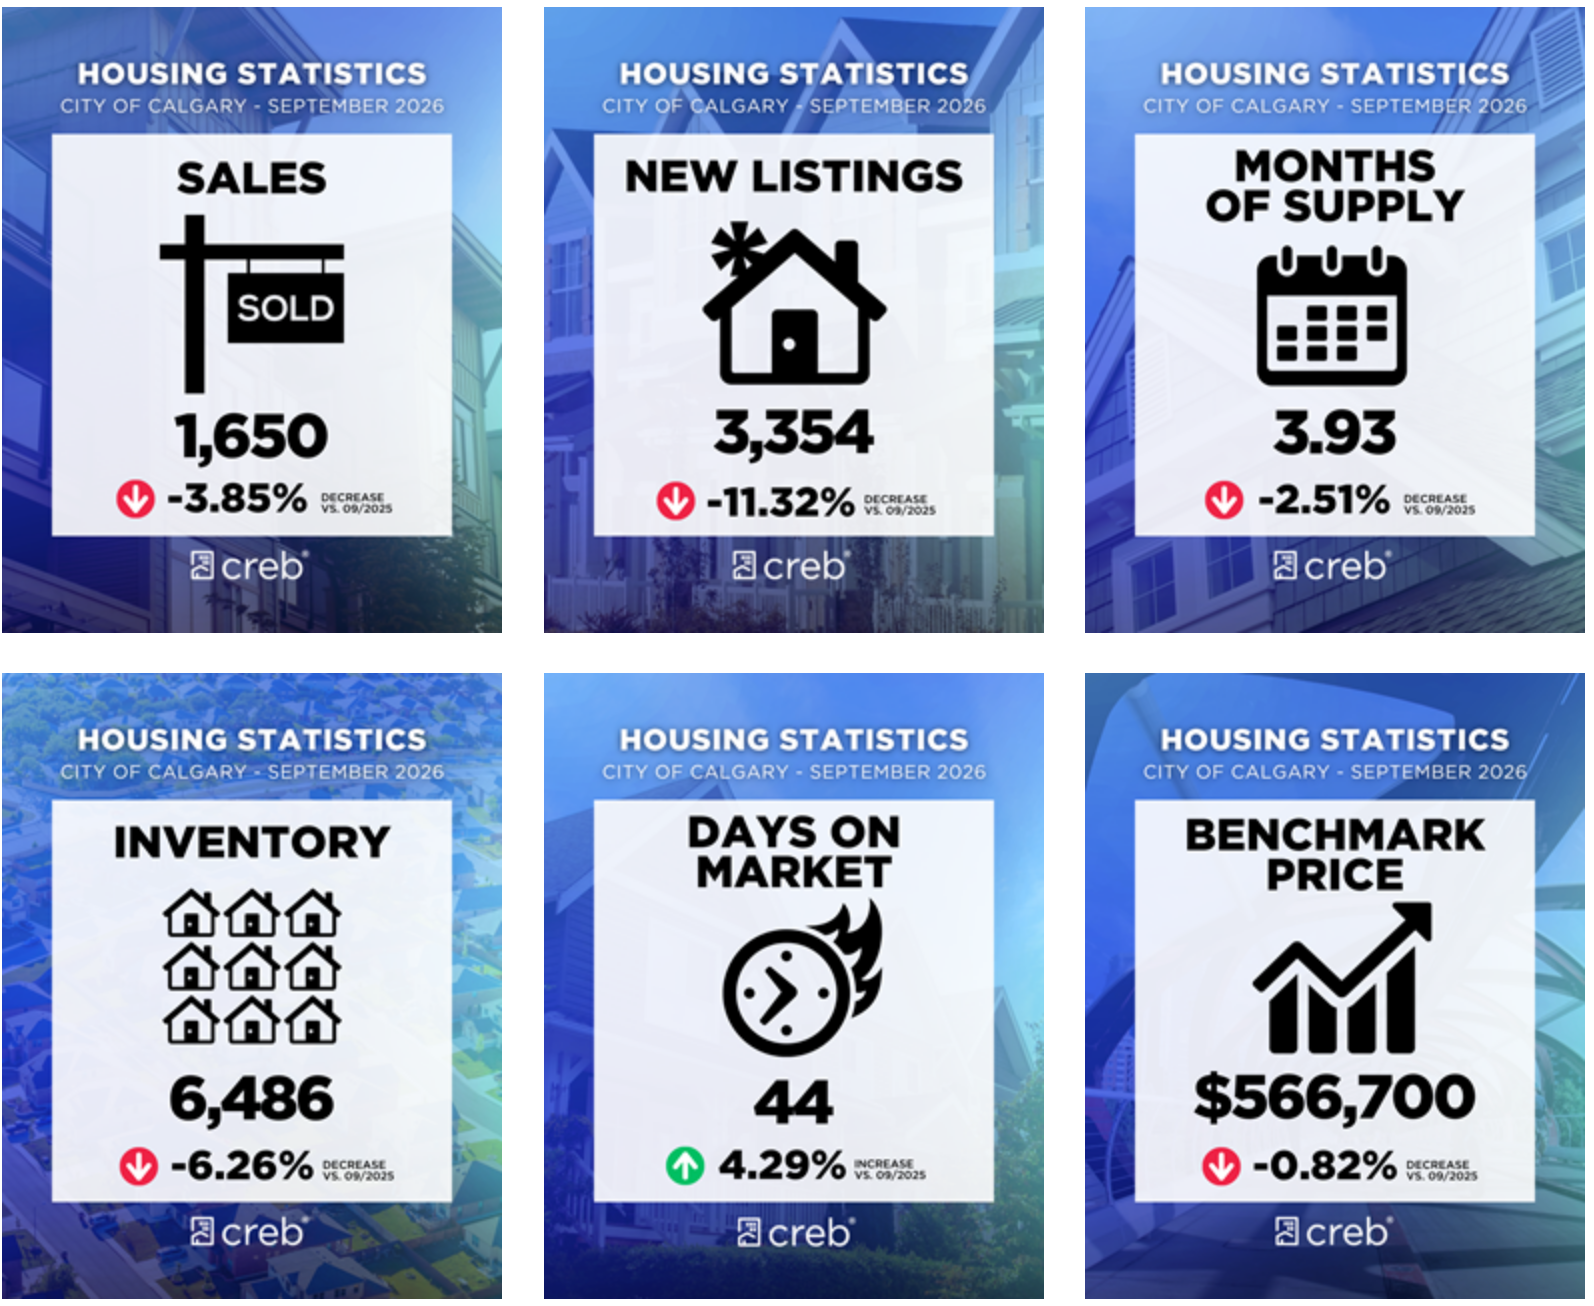
How is Calgary's real estate market doing in September 2026? Calgary's market is stable overall but split by property type. Sales reached 1,650 homes, about 4% below September 2025, while the benchmark price held at $566,700, down less than 1% year over year. Detached homes remain balanced, while apartments and townhomes are leaning toward a buyer's market.
Metric | September 2026 | Change vs. Sept 2025 |
|---|---|---|
Benchmark price | $566,700 | -0.82% |
Sales | 1,650 | -3.85% |
New listings | 3,354 | -11.32% |
Inventory | 6,486 | -6.26% |
Months of supply | 3.93 | -2.51% |
Days on market | 44 | +4.29% |
Sales held steady with August instead of following the usual September dip, thanks to stronger detached sales. New listings rose month over month, pushing the sales-to-new-listings ratio down to 49%. Inventory and months of supply were essentially unchanged from August.
Market conditions in Calgary depend heavily on what you're buying or selling.
Detached homes: Balanced market. More new listings in September helped lift detached sales.
Apartments and row homes: Buyer's market. Extra supply, plus competition from rentals and new construction, gives buyers more choice.
Why the split? According to CREB® Chief Economist Ann-Marie Lurie, the past three years of construction focused mainly on apartments and townhomes, while detached building didn't keep pace. Job growth and steady migration are still absorbing some new supply, but not enough to offset all the higher-density units added.
Prices are holding steady once seasonal patterns are factored out. The unadjusted benchmark of $566,700 is just under 1% below last year, and seasonally adjusted prices were relatively flat compared with August.
Property type | Year-over-year price change |
|---|---|
Detached | About -1% |
Apartment | About -6% |
Row | About -8% |
Detached price softness is concentrated in the North East, East and North districts.
Buyers: Apartments and townhomes offer the most negotiating room and selection right now. Detached homes are competitive but not frantic.
Sellers: Detached homes in well-located communities are still selling. Condo and townhome sellers should price sharply and present the home well to stand out.
What is the benchmark home price in Calgary in September 2026? The residential benchmark price was $566,700, down 0.82% from September 2025.
Is Calgary a buyer's or seller's market right now? It depends on property type. Detached homes are balanced, while apartments and row homes are in buyer's market territory.
How many homes sold in Calgary in September 2026? 1,650 homes sold, about 4% fewer than September 2025 and similar to August.
How long are Calgary homes taking to sell? Homes averaged 44 days on market, about 4% longer than a year ago.
Are Calgary home prices dropping? Only slightly overall. The biggest declines are in row homes (about 8%) and apartments (about 6%), while detached prices are down about 1%.
Every community and property type is moving differently this fall. Contact Josh Nelson and the Hanney Nelson Real Estate Team at Royal LePage Benchmark for a free, no-pressure look at what today's market means for your home or your search.
Call or text: 403-862-2877
Book a free consultation: Schedule a call with Josh
Source: Calgary Real Estate Board (CREB®), September 2026 housing statistics.

Dedicated to the People Behind Every Move
Eman is a determined, energetic, and dedicated REALTOR® who genuinely enjoys what she does—and, most importantly, the people she gets to meet along the way.
For Eman, real estate has always been about more than buying or selling a home. It’s about understanding people, listening to what matters to them, and being there throughout the process. She takes pride in paying attention to the details, staying involved, and making sure her clients always feel informed, comfortable, and confident in the decisions they’re making.
Eman has built strong relationships throughout her career, both with her clients and with REALTORS® and other professionals in the industry. She believes that being approachable, respectful, honest, and easy to work with makes a real difference. Many of the relationships she has developed through real estate have continued long after a transaction has been completed, and those lasting connections are something she values deeply.
Her dedication and hard work have been recognized with achievements including the President’s Gold Award and Top Producer. While she is proud of these accomplishments, they have also motivated her to keep pushing herself. Eman is always looking for ways to learn more, understand the market better, and improve the experience she provides to her clients. She embraces the fact that real estate is constantly changing and enjoys staying ahead of those changes.
At the end of the day, Eman simply cares about doing things properly. She brings her personality, energy, honesty, attention to detail, and strong work ethic to every client and every transaction. She is grateful for the trust her clients place in her and for the opportunity to be part of some of the biggest decisions and milestones in their lives.
For Eman, the greatest compliment isn’t simply a successful transaction—it’s when a client continues to stay in touch, refers a friend or family member, or becomes a relationship that lasts for years.

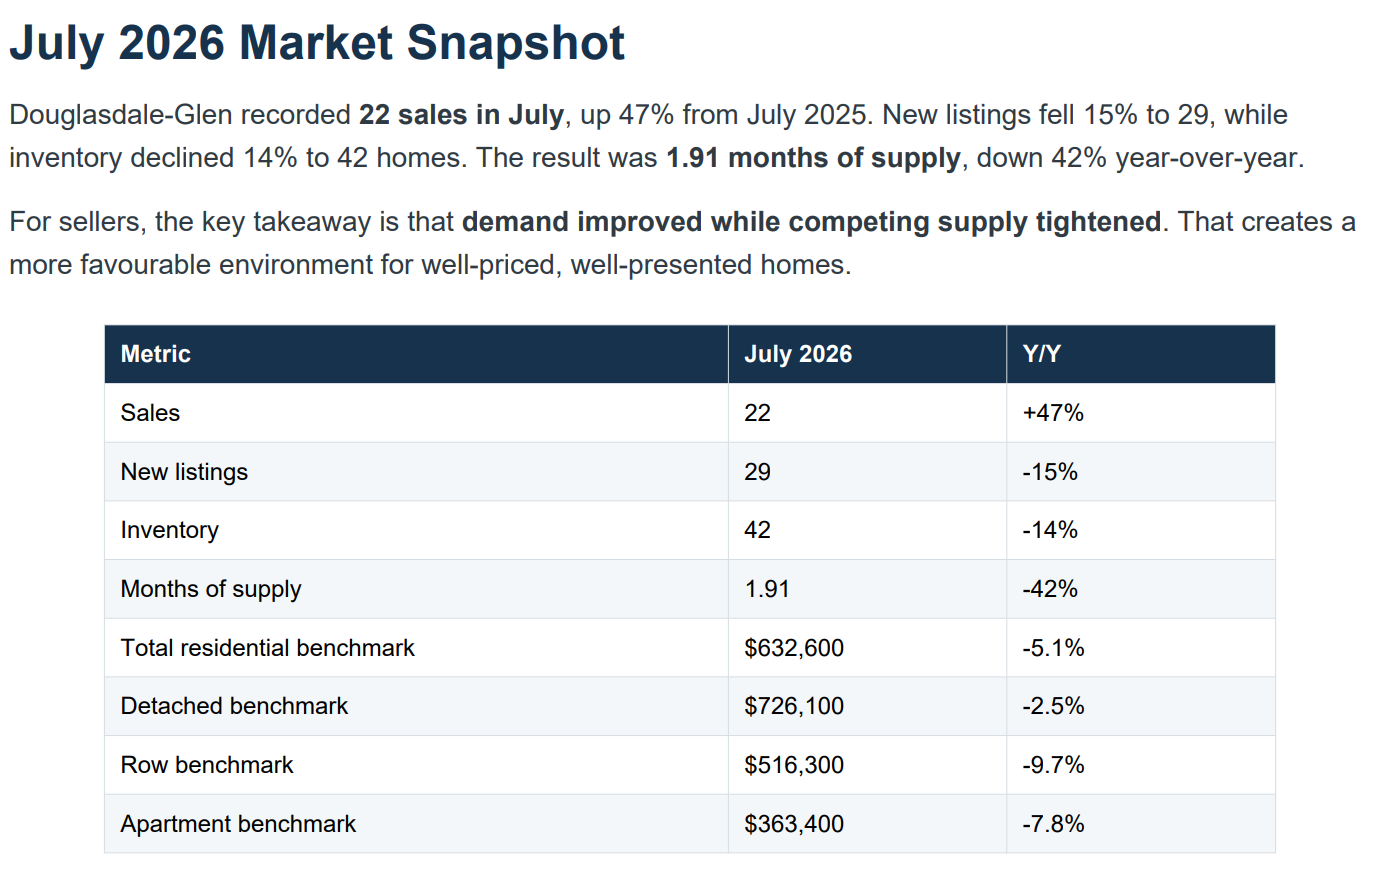
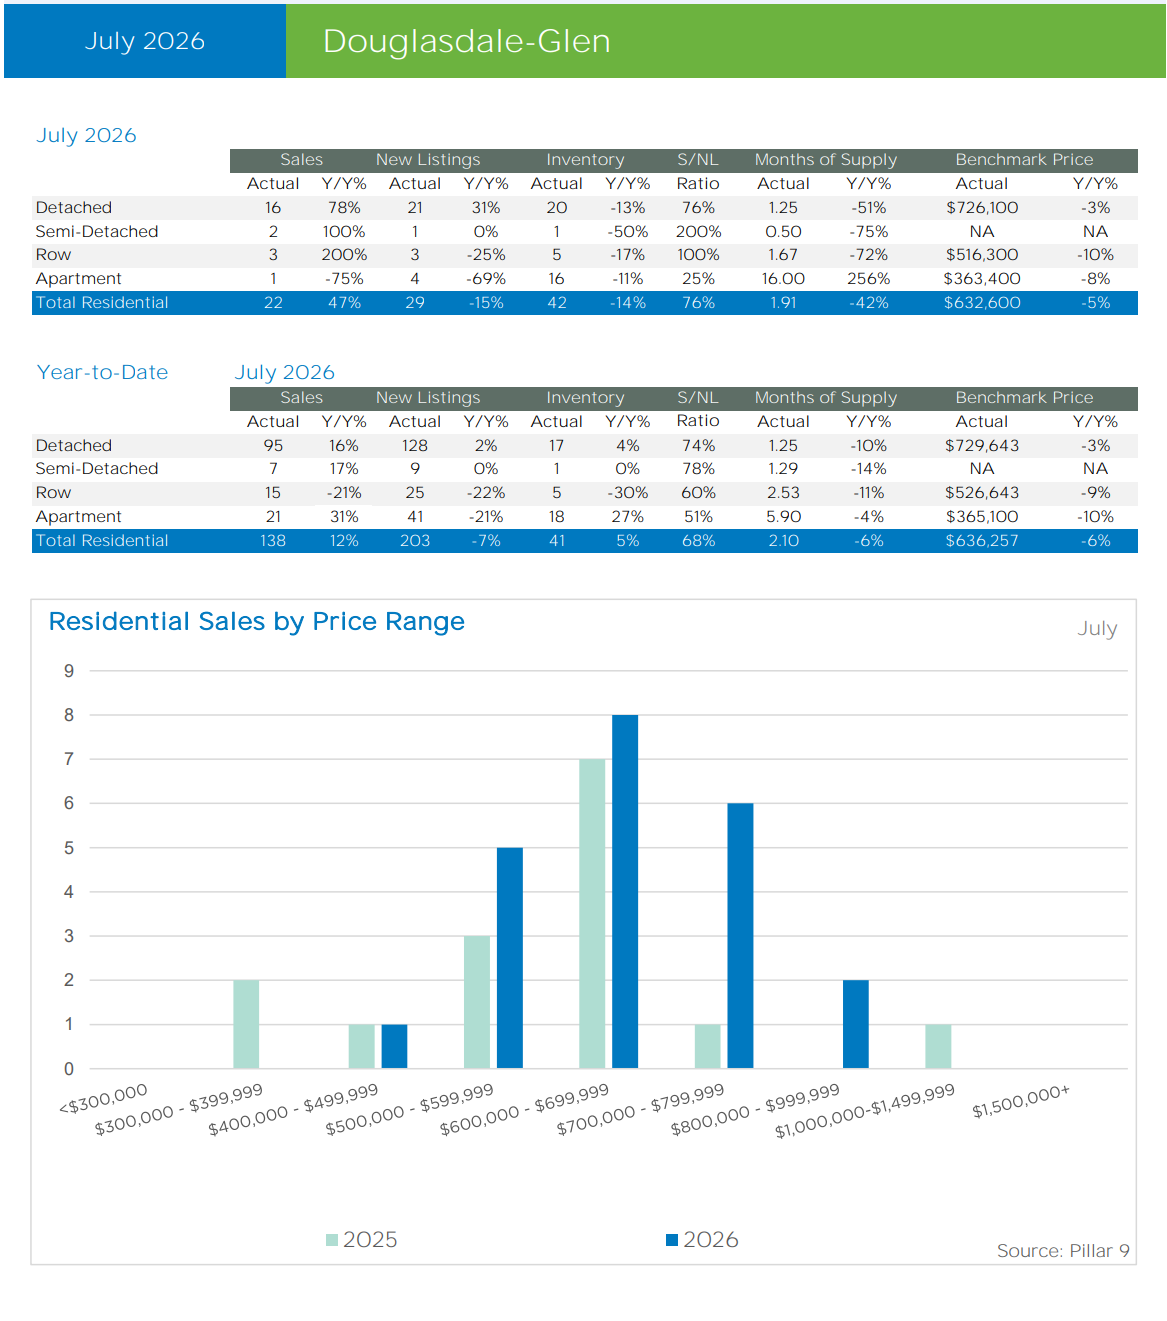
The local market is not simply about whether prices are rising or falling. The relationship between sales, new listings and inventory is equally important. In July, sales increased sharply while new listings declined, pushing supply lower. Detached homes were especially tight, with 16 sales, 20 homes in inventory and only 1.25 months of supply. That is a stronger negotiating position for sellers than the broader market numbers alone might suggest.
The total residential benchmark price was $632,600 in July, down 5.1% year-over-year. Detached benchmark pricing was $726,100, down only 2.5%. While prices have adjusted from earlier highs, the detached segment continues to show relative strength. For homeowners thinking about making a move, this is a market where pricing strategy matters. Buyers have more choice than during the most aggressive seller markets, but the amount of competing inventory has tightened compared with last summer. July also produced a meaningful improvement in sales activity. Year-to-date Douglasdale-Glen sales reached 138, up 12%, while year-to-date new listings were 203, down 7%. That combination points to active buyers meeting a more limited supply of homes. If you're considering selling, the goal should not be to chase a headline price. The goal is to position your home against today's competition, create strong early buyer interest, and use the current supply conditions to your advantage.
If you've been thinking about making a move, the first step is understanding what your home could realistically sell for in today's market—and what you could expect to net after selling costs. A property-specific evaluation can look at recent comparable sales, current competing listings, your home's condition and buyer demand for your particular property type. From there, you can decide whether to sell now, prepare for later, or make a move while the market is more favorable for your next purchase.
Josh Nelson
Hanney Nelson Real Estate Group | Royal LePage Benchmark
Managing Partner & Relocation Expert
Phone: 403-862-2877 Website: www.HanneyNelson.com
Download My App and Surf the MLS Like Never Before!
Connect with me: Instagram Twitter or X Facebook
For the last 25 years my business has been based on referrals. I'm never too busy to serve you, your family and friends. Your referral is the best compliment you can give. Thank you for your trust to be your Real Estate Professional!
Top 1% of all Royal LePage Realtors in Canada 2025
#159 in Canada, #3 in Alberta and #3 in Calgary 2025
Source: CREB® Monthly Summary Statistics, Douglasdale-Glen, July 2026. Market data and graphics are from the supplied report. Market conditions can vary by property type, price range and exact location.

Calgary’s market is slowing as we move into the second half of the year — but not all property types are experiencing the same conditions.
🔑 The Big Picture
🏠 1,904 sales | ⬇️ 9% YOY
📋 3,323 new listings | ⬇️ 15% YOY
📦 3.5 months of supply
💰 Benchmark price: $569,200 | ⬇️ 2% YOY
🏡 Detached
• $743,900 benchmark
• Nearly 3 months supply
• ⬇️ 2% YOY
➡️ Still relatively balanced
🏘️ Semi-Detached
• $691,000 benchmark
• Under 3 months supply
• Prices relatively stable
➡️ Balanced conditions
🏠 Row Homes
• $418,500 benchmark
• Nearly 4 months supply
• ⬇️ 6% YOY
➡️ More choice for buyers
🏢 Apartment Condos
• $297,600 benchmark
• Nearly 5 months supply
• ⬇️ 8%+ YOY
➡️ Buyer-favouring market
💡 THE TAKEAWAY
Calgary isn't one market right now.
Detached homes remain relatively balanced, while apartment condos continue to face higher inventory and price pressure.
For buyers, there are opportunities — especially in higher-density properties. For sellers, pricing and positioning are more important than ever.
📩 Want to know what’s happening in your Calgary neighbourhood? Send us a message.
#CalgaryRealEstate #CalgaryRealEstateMarket #CalgaryHomes #CalgaryCondos #CalgaryRealtor #YYCRealEstate #YYCHomes #CalgaryHousingMarket #CalgaryMLS #HanneyNelson

Your Trusted Partner in Real Estate. Contact me at 1-403-775-0272 for all your property needs.